

Tableau Dashboard
Overview:
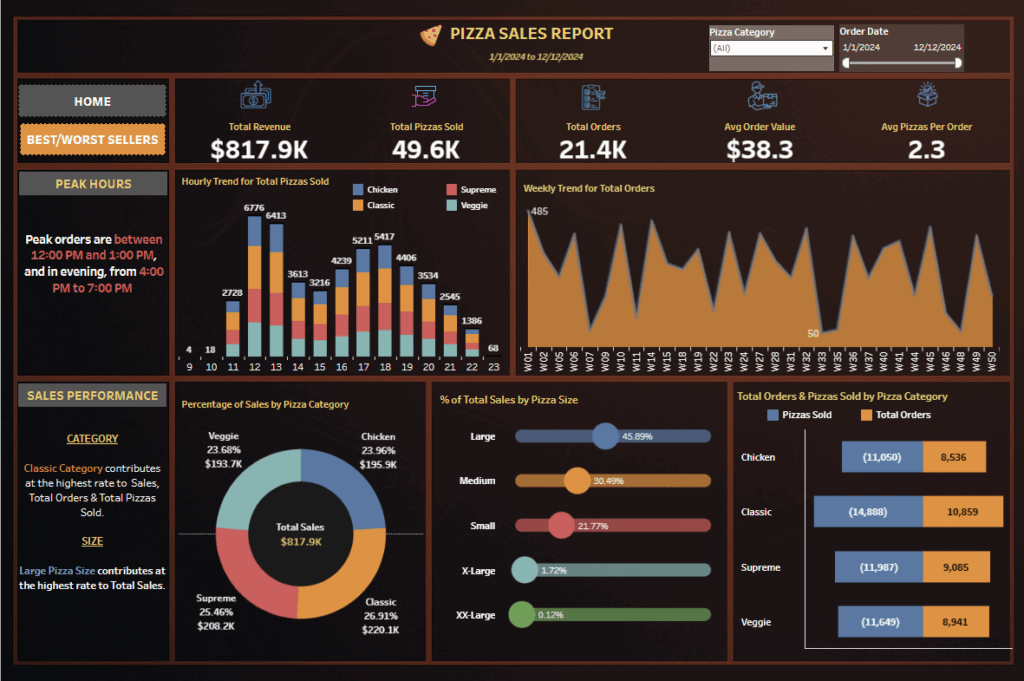
A data visualization project analyzing a year of pizza sales to uncover customer trends, peak performance periods, and product insights. Using SQL for data cleaning and Tableau for visualization, this dashboard turns raw restaurant data into actionable business intelligence.
Key Highlights:
Processed 48K+ transactions to identify peak hours and week demand patterns.
Revealed top and bottom-performing pizzas, guiding menu and marketing decisions.
Overcame date-format inconsistencies to ensure accurate time-based trend analysis.
Skills used
Call Center Performance Dashboard
Overview:
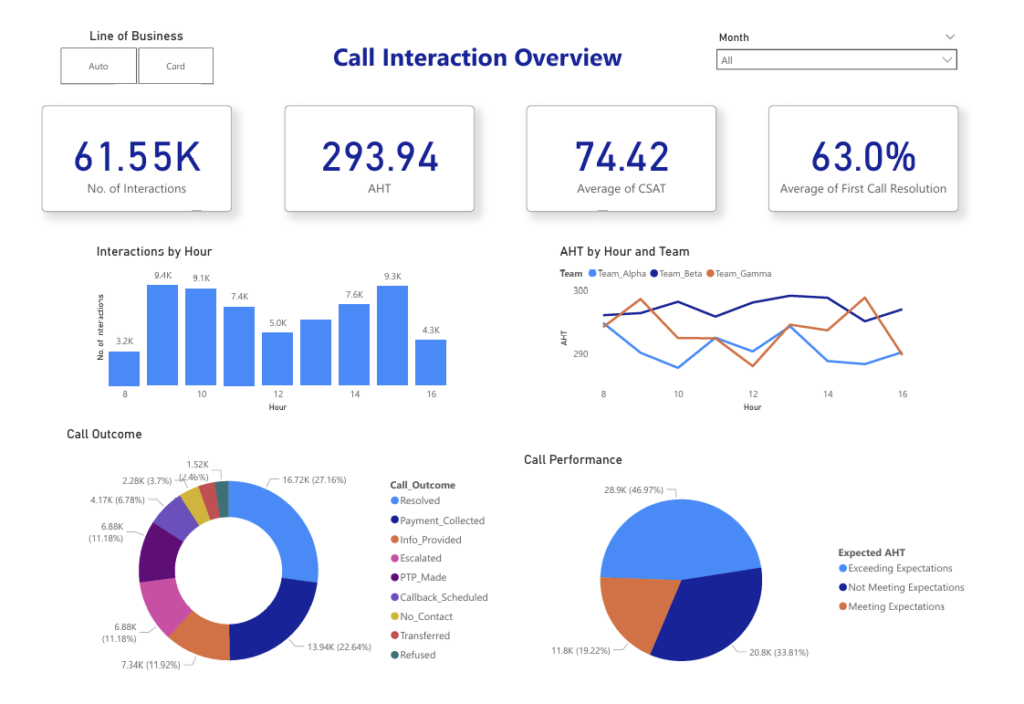
A multi-tier analytics dashboard analyzing 61.5K call interactions across 30 agents to optimize operational performance and customer satisfaction. Built in Power BI with synthetic data generation in Python, this project demonstrates end-to-end analytics capabilities for executive ready visualizations.
Key Highlights:
Engineered realistic dataset simulating 3 months of call center operations across 3 teams with business-driven patterns.
Created three interconnected dashboards (Executive>Team>Agent views) enabling drill-down analysis from high-level KPIs to individual performance.
Identified peak hour patterns (9-11 AM, 2-4 PM) and call complexity drivers, revealing that escalated calls average 15-20% higher handle times.
Designed performance segmentation showing 34% of interactions not meeting expectations, enabling targeted coaching interventions.
Skills used
Real Estate Data Project
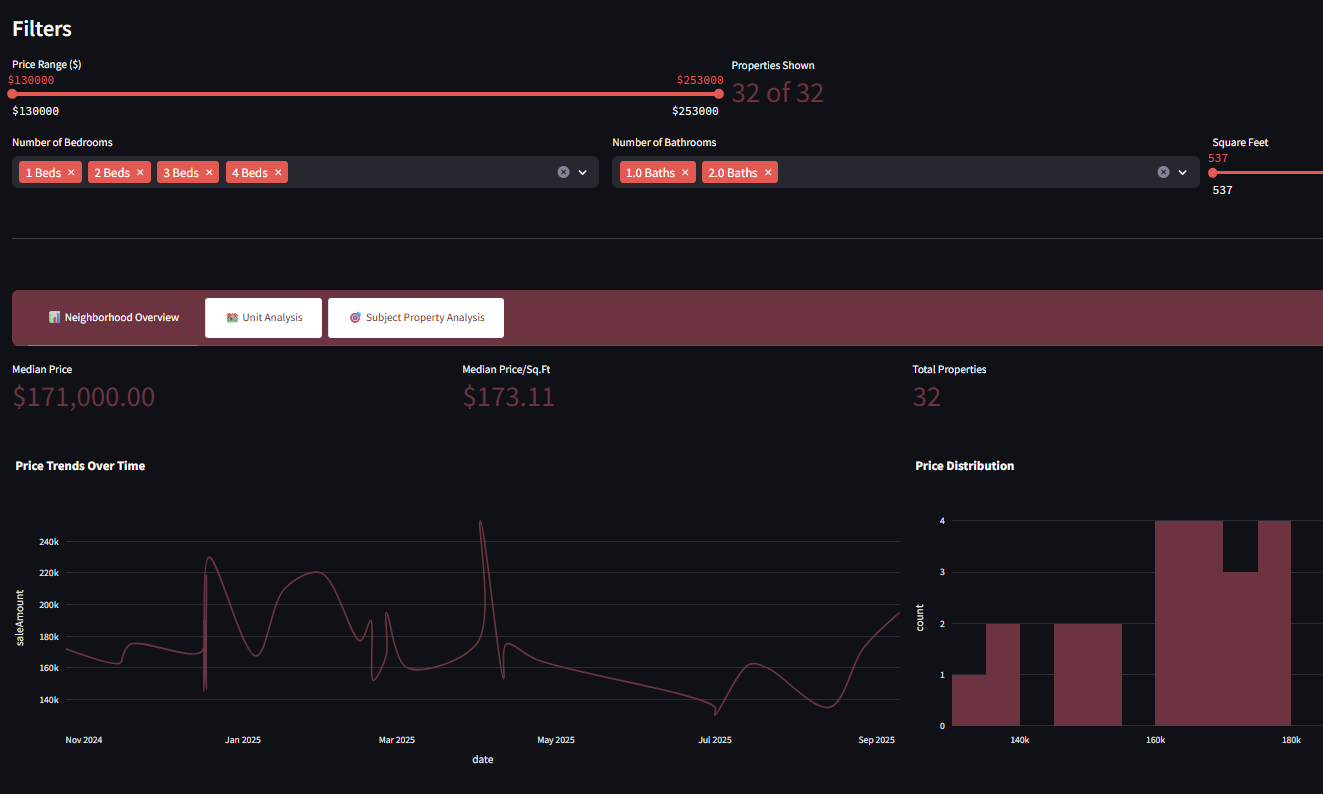
🏘️ Neighborhood Analyzer
Data-driven tool that compares properties across neighborhoods to uncover undervalued investments using real estate analytics.
Skills used

Fantasy Football Draft Data Analysis
🏈 Fantasy Football Insights
Overview:
This project combines sports strategy with data analytics to uncover hidden value in fantasy football drafts. Using player performance projections, it identifies elite and undervalued players across positions and visualizes the findings.